
Mapping Rainforest Loss
Understanding Global Rainforest Loss - On a Local Scale
HI! My name is Jonathan,
Studying geography in school in the 80’s I remember my textbooks talking about slash and burn agriculture. This, the books explained, was how communities that lived in rainforests cleared small areas of the forest, grew vegetables for a few years then moved on to another area, allowing the original patch to return to jungle. This sounded delightful - man and nature in pretty good harmony. There were no photos of slash and burn, but we grew lots of vegetables in our suburban garden, so I pictured each family managing on an area about that size.
Later in the early 90’s, my adventurous spirit led me to Indonesia, and after backpacking around Java and Bali I took a boat across the Java Sea to Pontianak on Borneo. I took a bus inland to Sanggua, where the tarmac road ran out, and then a boat up the Kapuas River to Sintang. This was a four-person speedboat with six passengers plus a pilot squeezed in. Our luggage was strapped onto the bow, blocking the pilot’s view of the river, so a small boy sat on top of the luggage pile, shouting directions to guide him around the huge logs drifting downriver.

Arriving in Sintang © J Robson 2021
In Pontianak a fellow traveller had asked me to pass a message to the French missionary living in Sintang so the next day I went to seek him out. We had a pleasant tea in his garden and he asked me if I would like to join him on a visit to a longhouse community in the forest. I would! He leant me a motorbike and we set off, travelling two hours on dirt road, then dirt track, then footpaths through recovering rainforest that had clearly been farmed. Here was actual slash and burn in action. The village consisted of two longhouses for around twenty families.

Longhouse © J Robson 2021
We were told the village was clearing a new patch of forest to plant cassava just a short walk away. As the village headman was there, and the priest wanted to speak with him, we left the motorbikes and walked through forest that had mostly recovered from previously being farmed - about five year’s of recovery, I was told. Coming through the tangle of jungle to the newly cleared land, this is what I beheld…


Slash and burn © J Robson 2021
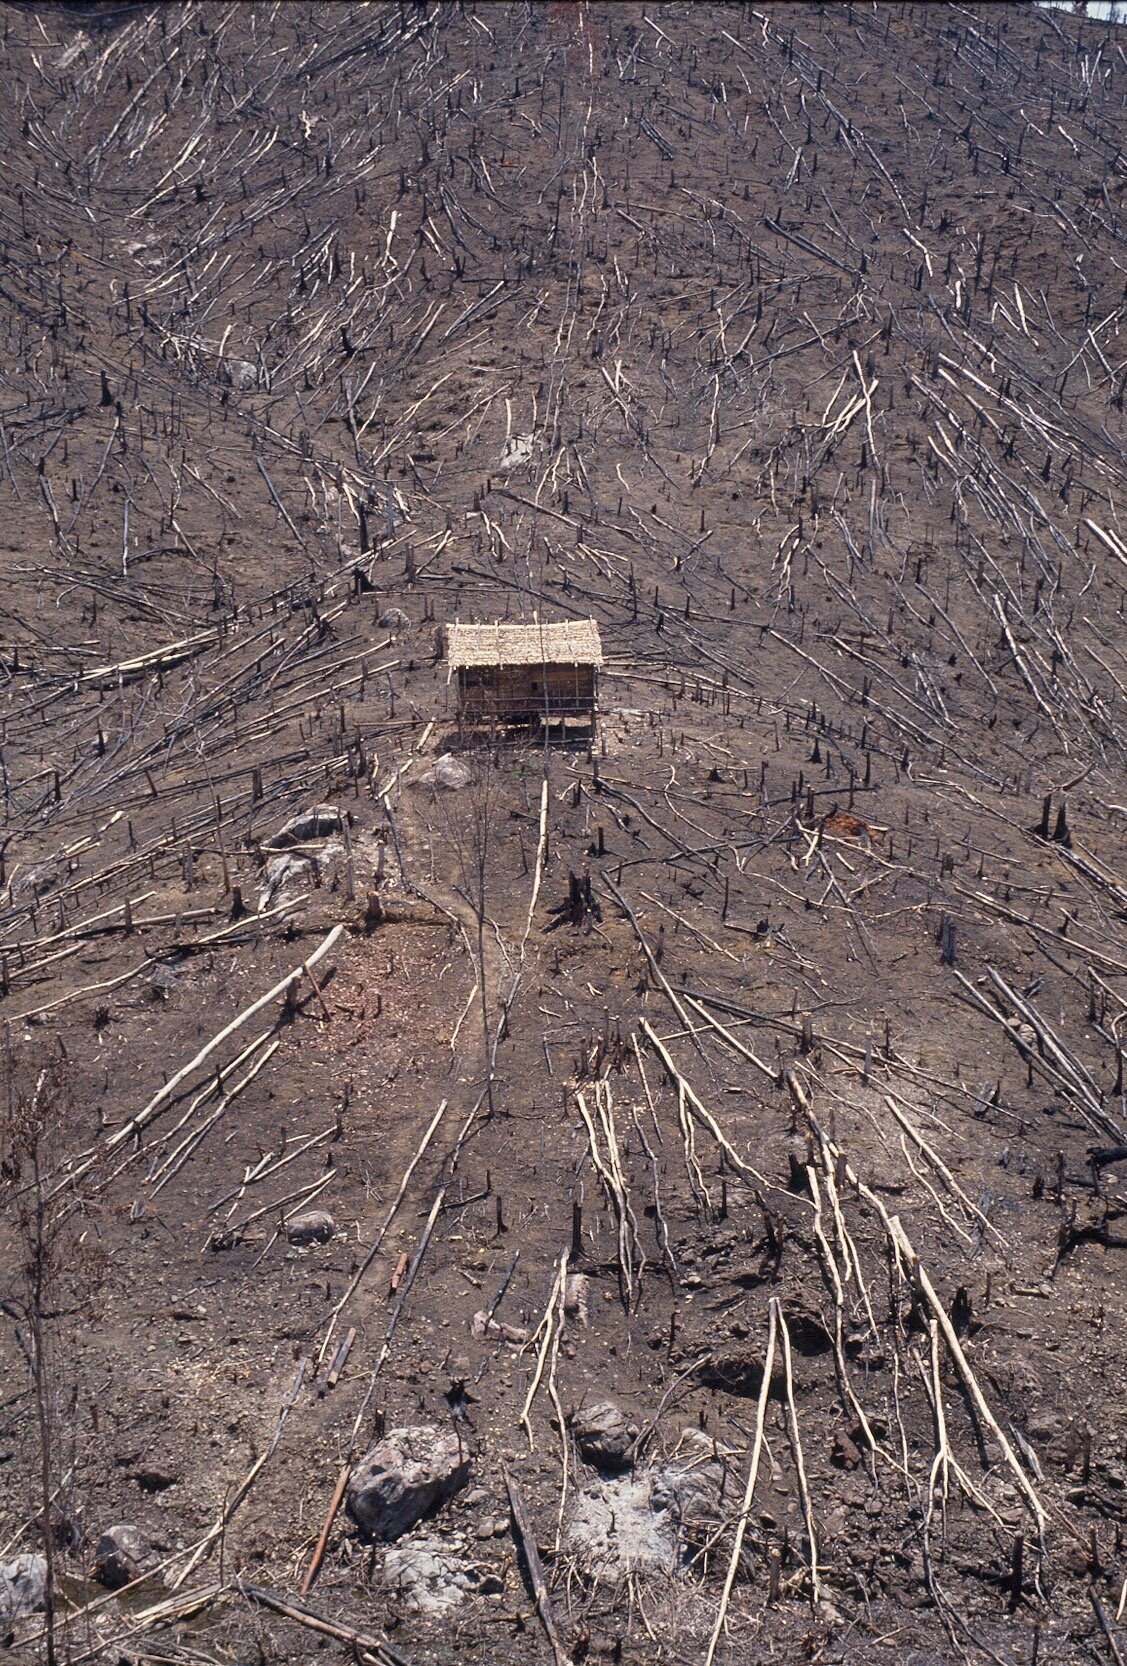
Not quite what I had pictured from my geography books - the villagers planting cassava looked like ants on the razed hillside. Rainforest soil is very poor so the area of land needed to feed just a small village is a lot larger than the few suburban garden plots I had naively pictured as a teenager.
The image of that hillside stayed with me. Recently, as an artist working with trees and using their rings to give context to how the life of a tree spans entire human generations, I returned to it. I began wondering that if this much forest (so much more than I had imagined) was required to feed a small community then how much forest was being destroyed to meet the demands of large-scale agriculture, logging, mining and fossil fuel production in order to supply our everyday needs?
The answer to that wasn’t too hard to find. The World Resources Institute, Global Forest Review uses the moving average to calculate the current global loss of primary tropical forest at 3.87 million hectares per year.
I had no idea what that meant.
I Googled some pictures to see if that helped and found plenty of images of rainforest destruction but still, the scale still didn’t really mean anything to me.

Forest and pasture lands meet. http://www.ibama.gov.br CC2.0
So, I started thinking of ways to be able to understand just how much forest is being destroyed, even though I was sitting on the opposite side of the planet to where this was happening. To make it relatable I needed to make it local to me, and I needed to scale down the numbers. I started to do some maths.
If 3.87 million hectares is being lost in a year, how much was that per day or per hour? I calculated that at 10,595.48 hectares per day and 441.48 hectares per hour. Nope. I still no idea what that meant.
So, I converted those numbers to circles of equivalent diameter in metres and used Leaflet, an open-source mapping software, to show those circles with my location in southeast London at the centre.

Wow! That’s a big area. I zoomed in on the one hour circle that covered my neighbourhood.
Finally, things were at a scale that my mind could understand. That’s a lot of trees!
But to really drive home the scale of things I wondered how long it would take me to walk around that area. I got out my phone, downloaded an exercise mapping app and planned a route as closely as roads and railway lines would allow. Then I picked a starting point that would get the hills out of the way early and set off. Here’s a screenshot of the results - 6.22 miles. It took two days for my feet to stop feeling sore.


So now I think I can finally picture just how much rainforest is being destroyed across the planet in an hour. I’ve walked it.
To encourage more people to try this as a way to understand the scale of rainforest loss I’ve put the mapping app on my website, planetAprinting.com and set up the #MapMyForest challenge: walk, run or cycle across or around the area of your neighbourhood that is lost in a day or an hour, share your results on social media and challenge your friends to do better. And take a photo of a tree along the way.
And there are ways you can reduce your personal impact on the remaining forests and do your bit to help slow their destruction.
• Beef, soybean and palm oil production are major drivers of tropical deforestation so reduce or eliminate them from your diet.
• Buy responsibly sourced products.
• Reduce your paper and wood consumption and look for rainforest-safe suppliers.
• Reduce demand for fossil fuels by using renewable energy suppliers.
• Look for companies that offset their carbon footprint with REDD+ carbon credits. Credits are not a final solution for climate change but they seem to be the best option we have at the moment. REDD+ stands for Reducing Emissions from Deforestation and forest Degradation + taking into account conservation of forest carbon stocks, sustainable management of forests, and enhancement of forest carbon stocks. All this while respecting the needs of indigenous peoples.
It’s very difficult for any of us to understand the scale of a global problem, especially when it’s happening on the other side of the world. Making it local gives us terms of reference we can comprehend - and that helps us see what we can do to help.
Go to https://planetaprinting.com/pages/map to get an idea of the scale in relation to your neighbourhood.